Episode 2: Navigating Today’s Commercial Real Estate Landscape with Dan Rosenbloom
.svg)


.png)

Prospective real estate investors must take a wide range of factors into account when determining if an investment opportunity is worth the risk.
A property’s location and the trajectory of its immediate surroundings - population growth, crime rates, quality of schools, access to transportation, etc. - are the most fundamental traits to evaluate. Other structural factors, such as a building’s condition and the costs to renovate for value-add opportunities, must also be considered. On the financial side, investors have to think about the cost of debt, capital structure, and the investment horizon for each opportunity.
Taking stock of all the factors above is still just scratching the surface for making an ultimate determination. Evaluating properties can be complex, and usually deciding to invest in a property or pass on it is not a straightforward decision.
On the latest episode of Cadre’s Real Estate of Mind podcast, Cadre Founder, CEO and Executive Chairman Ryan Williams was joined by Cadre Chief Investment Office Dan Rosenbloom. Together, they discussed commercial real estate investment strategy, from both a macro and micro lens. Dan talked through some of the factors that guide Cadre’s thesis for investment decisions, as well as some specific investments he’s been involved in throughout his career.
One of the most prominent factors in the conversation was cap rates. This blog will take a closer look at the metric and why cap rates are so crucial for forming investment decisions.
Cap Rates: an Overview
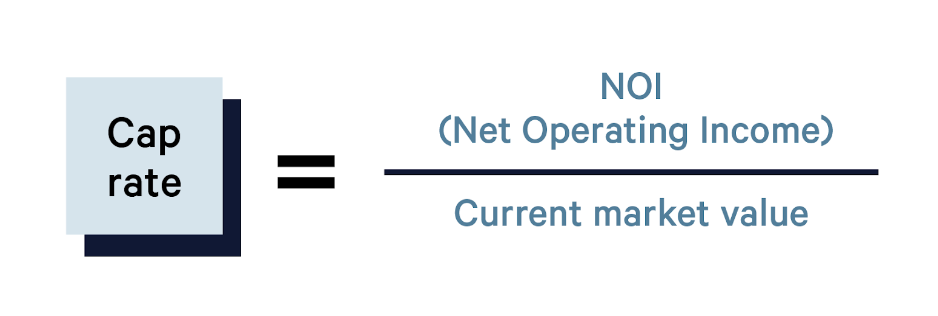
At the most basic level, the cap rate is determined by taking the net operating income (NOI) of an asset and dividing that by its cost, or market value. This rate is then expressed as a percentage.
Cap rates do not stay static over time; they either compress or expand. Generally speaking, a lower cap rate indicates a higher value, while a higher rate suggests greater risk.
Cap rates are powerful tools for real estate evaluators and prospective investors. For instance, they’re inflation-adjusted, so investors can focus on returns without worrying about inflation modifications. They also provide a uniform metric for efficiently determining the perceived value of an asset and for quickly comparing properties. Finally, cap rates inform a comprehensive overview of assets at both the property and market levels.
To fully understand cap rates and their usefulness for evaluating properties, it’s important to grasp why these rates may move up or down. If the numerator of the cap rate shifts, this means that the net operating income of the asset is changing. Typically, this means that rent collections or occupancy rates are in flux. Oftentimes, the more significant cap rate fluctuation is denominator-driven. These denominator changes indicate movement in the asset’s real or perceived value. Investors must be sharply attuned to asset values at all times lest they change too rapidly.
Once investors understand cap rates and how they move, they can start to apply that knowledge. To become fully fluent in working with cap rates, it’s important to understand how to interpret their meaning at a national, market, and asset level.
Applications of Cap Rates
Macroeconomic Level
Investment volume in commercial properties declined1 for the first time since the pandemic in the back half of 2022 and into the start of this year. At the surface level, cap rates may not appear to explain the dropoff. The difference between cap rates in 2019 and today is largely flat2; a bit higher than what they were in 2019 but not significantly so.
Upon a closer look, we gain a more comprehensive view of the CRE environment. Commercial properties have experienced drops in average operating income and market value, impacting both the numerator and denominator of the cap rate equation. Given the impact of interest rates on operating expenses, cost of debt, and downward pressure on revenue growth, we can explain the muted expansion in cap rates.
For investors to feel greater confidence in national market conditions, cap rates would need to experience a more dramatic shift. That could mean assets mark to market and begin to trade more frequently, ultimately raising values – or, inversely operating income growing to push cap rates higher. Only then could investors expect to project similar absolute returns commensurate with the pre-pandemic market.
Market Level
Accurately projecting cap rates at the market level can be an incredibly powerful tool for making an investment in a location of interest.
Current cap rate metrics for any given market can be easily researched, but projecting how the market will develop can be a crucial differentiator. It’s not a simple task, and investors who know a given market well gain a massive advantage. Another way to generate trustworthy projections is by building relationships with operators in specific markets. In the most ideal partnerships, these operators have years of experience investing in a particular market, with a track record of proven results.
With this type of market analysis, predicting a future hotspot for growth is the best case scenario. Being ahead on a market like Charleston or Raleigh years ago certainly has paid off for some who saw a population explosion coming.
But edges can be found even in better-known markets. Take Austin, Texas as an example. Austin has been a hot market for a long time, seeing steady gains in population growth that rapidly accelerated during the pandemic. This population swell helped propel a cap rate expansion in Austin, with upticks in rental income and property prices safely projectable.
Still, Cadre’s knowledge of the market and proprietary forecasting model suggested market growth would have a longer tail than most projections predicted. Seeing that there was still value beyond Austin’s already-optimistic forecasts, Cadre ultimately decided to invest in a property in the area.
Asset Level
Ultimately, discerning investors make decisions at the asset level, looking beyond macro and market noise.
Prior to the pandemic, Cadre invested in a Nashville-based asset. The investment was underwritten with a particular cap rate, and the team had plans for major renovations and expansion for the site. Fortunately, in accordance with team policy, Cadre projected a conservative exit cap. Despite the drastically different environment following the onset of COVID-19, the conservative exit cap and underlying value of the asset gave the team room to change its business plan, secure an attractive partial sale of the asset, and renegotiate lending terms.
While the COVID outbreak was a once-in-a-century type of market disruptor, it illustrated the importance of preparing for challenging scenarios and understanding all the existing opportunities and risks in a given asset.
For more practical information about how cap rates can be digested and applied, listen to episode two of Cadre’s Real Estate of Mind podcast. Dan shares some specific examples of how cap rates guided his investment decisions, and Ryan provides a detailed overview of how to approach cap rate analysis.
Cadre’s newest fund, the Direct Access Fund II, uses data from proprietary forecasting models that capture and anticipate cap rate movement to inform investment decisions. The fund will provide investors with access to mid-cap investment opportunities across multifamily, industrial, office, and hotels. Contact our team to hear more about our data, opportunities, and important disclosures today.
Disclaimer
Educational Communication
Not AdviceThe views expressed above are presented only for educational and informational purposes and are subject to change in the future. No specific securities or services are being promoted or offered herein.
Not Advice
This communication is not to be construed as investment, tax, or legal advice in relation to the relevant subject matter; investors must seek their own legal or other professional advice.
Performance Not Guaranteed
Past performance is no guarantee of future results. Any historical returns, expected returns, or probability projections are not guaranteed and may not reflect actual future performance.
Risk of Loss
All securities involve a high degree of risk and may result in partial or total loss of your investment.
Liquidity Not Guaranteed
Investments offered by Cadre are illiquid and there is never any guarantee that you will be able to exit your investments on the Secondary Market or at what price an exit (if any) will be achieved.
Not a Public Exchange
The Cadre Secondary Market is NOT a stock exchange or public securities exchange, there is no guarantee of liquidity and no guarantee that the Cadre Secondary Market will continue to operate or remain available to investors.
Opportunity Zones Disclosure
Any discussion regarding “Opportunity Zones” — including the viability of recycling proceeds from a sale or buyout — is based on advice received regarding the interpretation of provisions of the Tax Cut and Jobs Act of 2017 (the “Jobs Act”) and relevant guidances, including, among other things, two sets of proposed regulations and the final regulations issued by the IRS and Treasury Department in December of 2019. A number of unanswered questions still exist and various uncertainties remain as to the interpretation of the Jobs Act and the rules related to Opportunity Zones investments. We cannot predict what impact, if any, additional guidance, including future legislation, administrative rulings, or court decisions will have and there is risk that any investment marketed as an Opportunity Zone investment will not qualify for, and investors will not realize the benefits they expect from, an Opportunity Zone investment. We also cannot guarantee any specific benefit or outcome of any investment made in reliance upon the above.
Cadre makes no representations, express or implied, regarding the accuracy or completeness of this information, and the reader accepts all risks in relying on the above information for any purpose whatsoever. Any actual transactions described herein are for illustrative purposes only and, unless otherwise stated in the presentation, are presented as of underwriting and may not be indicative of actual performance. Transactions presented may have been selected based on a number of factors such as asset type, geography, or transaction date, among others. Certain information presented or relied upon in this presentation may have been obtained from third-party sources believed to be reliable, however, we do not guarantee the accuracy, completeness or fairness of the information presented.
No U.S. or foreign securities commission or regulatory authority has recommended or approved any investment or the accuracy or completeness of any of the information or materials provided by or through us.
.svg)

